According to C. Gustavo De Moraes, MD, PhD, MPH, an ophthalmologist at NewYork-Presbyterian/Columbia, approximately 3 million Americans have glaucoma and half of them are unaware that they have the disease due to the absence of early symptoms. “This is a most concerning problem,” says Dr. De Moraes. “In the past, people thought increased intraocular pressure was enough to diagnose glaucoma. But we now know that many people with high pressure never develop the disease and many with low pressure have the disease. The group of patients with high pressure is particularly interesting because they are at greater risk of developing glaucoma. If I have a patient with high pressure at high risk, where should I look for signs of disease progression over time with the standard tests that we use for diagnosis? To determine this, we needed to understand the regions of the optic disc with vulnerability. This led to our current study on visual field progression patterns.”
The combination of optical coherence tomography (OCT) and the visual field test that measures central and peripheral vision are the primary tests for diagnosing glaucoma. Dr. De Moraes recently collaborated on a glaucoma study that used the Ocular Hypertension Treatment Study (OHTS) database to analyze visual field progression patterns in relation to vulnerability regions of the optic disc. “Our goal was to determine the locations on the 24-2 visual field-testing grid that would indicate progression in patients with ocular hypertension,” says Dr. De Moraes. “Identifying the locations and regions of the visual field that are more likely to change from glaucoma provides us with a greater certainty of diagnosis, enabling us to make more informed decisions about treatment.”
That landmark clinical trial, in which NewYork-Presbyterian/Columbia physicians participated, described the natural history of ocular hypertension and progression to primary open-angle glaucoma while demonstrating that treatment to lower intraocular pressure could reduce the risk for progression by half.
“The OHTS database, which contains thousands of tests, allowed us to identify regions changing most rapidly over time,” notes Dr. De Moraes. “Even if a region is not flagged as abnormal, it may still be undergoing change before it crosses the threshold of abnormality.”
Dr. De Moraes and the study team hypothesized that the nasal and paracentral regions would be more prone to show a reduction in sensitivity based on a structural model of superior and inferior areas of relative vulnerability at the optic disc.
Optic Nerve Imaging Yields Important Findings
In their study, the researchers analyzed data from the first two phases of the OHTS to measure the rate of change in all 52 locations of the visual field and identify those that are most likely to change rapidly. “By identifying each location of the visual field that corresponds in the optic nerve, we could now ascertain exactly where in the optic nerve the disease is more active,” says Dr. De Moraes. “While the visual field test is a subjective test, the optic nerve imaging gives us very objective information on where to look for regions of vulnerability.”

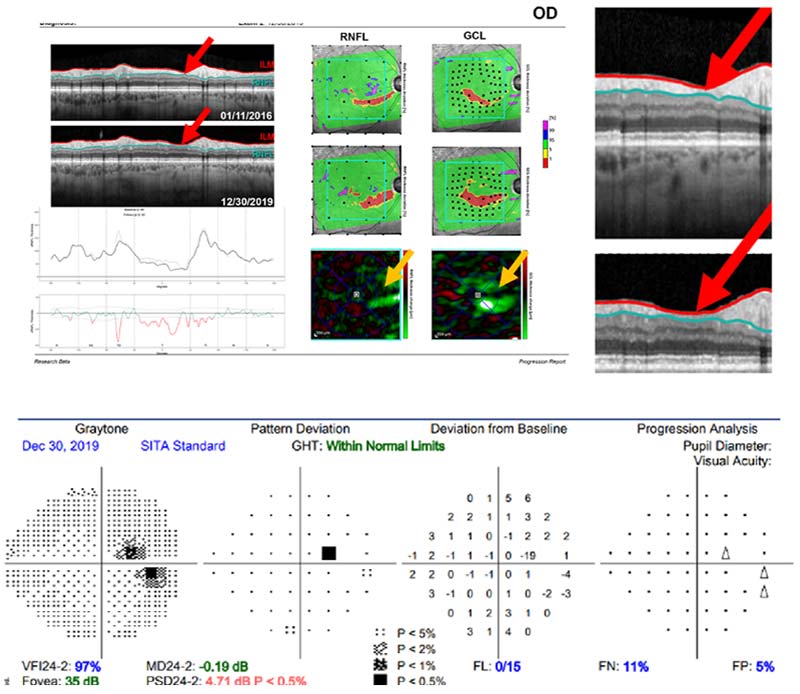
Top panel: OCT of the optic disc with red arrows showing area of vulnerability.
Bottom panel: Visual field showing are of damage (black square) in the central part of vision.
The research team evaluated 2,749,398 test points from 58,115 visual fields of 1,188 patients (2,369 eyes) in the study. The results on visual field progression patterns, published in the February 14, 2024, online issue of Eye, showed:
- Events were most commonly found in the nasal and paracentral regions.
- The same regions, with some modest variation, were found to have the fastest rates of progression.
- A similar pattern of progression was observed in both the early and delayed treatment groups.
- The difference in event rates and rate of progression between the early and delayed treatment groups was also greatest in the nasal and paracentral regions.
- At least one pointwise event occurred in 1,547 (65.3%) of the 2,369 eyes reviewed in the study.
“Although prior to our study there was some suggestion of the location of these regions, we now know with certainty which are anatomically more fragile and therefore more susceptible to change,” says Dr. De Moraes. “We were able to demonstrate clinically where we should be looking for these changes when determining a glaucoma diagnosis. This increases the likelihood of making an accurate and earlier diagnosis and intervene accordingly before someone develops visual field loss.”
“Currently, the commercially available field test is a one-size-fits-all approach encompassing the 52 points throughout central and peripheral vision,” adds Dr. De Moraes. “With results from our study, we are now developing new computerized algorithms to customize diagnostic testing to the specific visual field locations of the patient’s regional vulnerabilities. Based on our findings, we have begun validating this more focused approach clinically with the goal of making it widely available to our patients. We are also incorporating artificial intelligence methods to train an algorithm to look at the optic nerve and determine if the patient has glaucoma.”
Additionally, Dr. De Moraes and his study co-authors suggest, “While further studies are needed to validate these findings and evaluate their clinical significance, it seems that it might be prudent to carefully monitor these locations to facilitate early detection of progression and that timely treatment may help reduce the rate of progression in these locations.”
On the Horizon
Dr. De Moraes and his colleagues in the Department of Ophthalmology at NewYork-Presbyterian/Columbia are also actively pursuing promising avenues seeking to halt the glaucoma from progressing rather than treating it after vision is lost. “We know that even with the current standard of care, about 20 percent of glaucoma patients continue to progress to blindness,” says Dr. De Moraes. “It is unacceptable in my opinion to have a disease for which the current standard of care still allows such a high number of patients to worsen. There are new strategies that are independent of eye pressure such as neuroprotection to preserve the optic nerves. We are also exploring an injection delivery system and minimally invasive surgical approaches that can lower pressure significantly and reduce the burden of drops.”
“Because we know that today’s blanket testing approach is ineffective and inefficient, using clinical trial data as we did for our study will help in identifying where to look for changes and treating patients with increased precision,” adds Dr. De Moraes. “Our research is contributing to this more personalized approach to glaucoma care and to designing clinical trials that could be of shorter duration, less expensive, and expedite the development of novel therapies.”


